$ global

Eptakode Analysis_

Eptalights Research Company

EptaKode helps hackers, researchers, and developers effortlessly perform code analysis, discover bugs, conduct variant analysis, and leverage advanced AI for deeper program analysis and faster research workflows.

$ ls -C features/_

Everything you need to understand code

From a single function to a whole build, Eptakode turns code into something you can search, trace and reason about, together.

01 flows

Investigate together, in one workspace

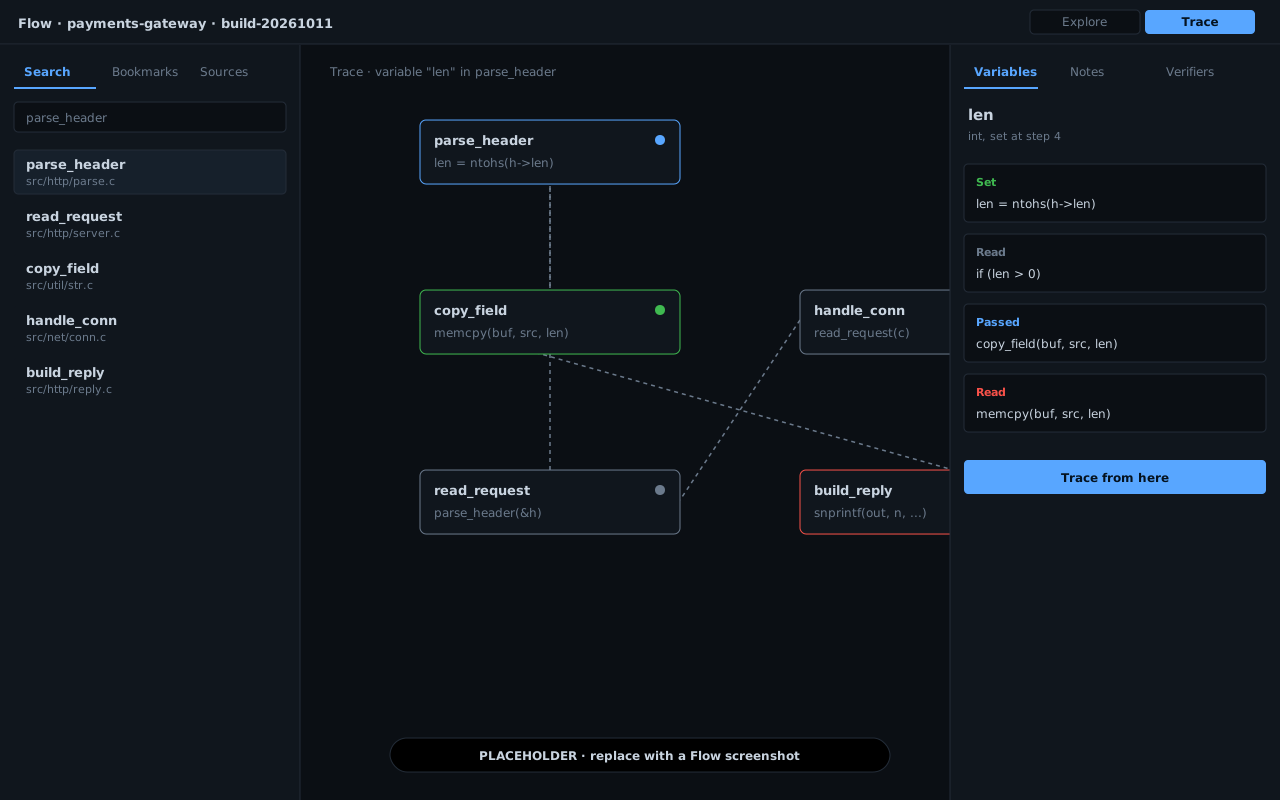
A Flow is a shared workspace for one project build. Open any function as a graph, step list or decompiled code, follow a variable from caller to callee, and keep your notes with the team. Nothing to install.

  • Trace a variable across function calls, one trace at a time
  • Run your verifiers along the path, or trace freely to just explore
  • Ask an AI whether a trace is a real vulnerability, or copy the code as a ready prompt
  • Notes, bookmarks and traces are saved for everyone on the team
Placeholder for a screenshot of the Eptakode Flow workspace
Flow workspace: search and bookmarks on the left, trace graph in the middle, variables on the right.

02 dataflow analysis

Follow data from where it enters to where it hurts

Trace how a value moves through a program: which calls lead to a dangerous function, whether data from a source reaches a sink, what ends up in a sink argument, and whether a validator sits in between.

  • Call chains between any two functions
  • Source-to-sink paths, with the exact steps along the way
  • Sink arguments and validators checked separately
  • The same engine powers variable tracing in Flows
dataflow.py
import eptakode

api = eptakode.LocalAPI("./eptakode.toml")

source = "/example/src/03_scanf_to_malloc.cc:main#1"
sink = "/example/src/13_struct_pointer_arithmetic.cc:main#1"

# which call chains lead from the source to the dangerous function?
chains = api.dataflow_trace_call_chain(source, sink)

# does data from the source actually flow into the sink?
paths = api.dataflow_find_source_to_sink_paths(source, sink)

# what reaches argument 0 of the sink?
arg = api.dataflow_analyze_sink_argument(sink, arg_index=0)

# and does a validator sit in between?
check = api.dataflow_analyze_validator(validator_fid, sink)

03 agents

Describe what to look for. Let an agent investigate.

An agent is a name, a plain-language description of sources, sinks and validators, and a set of tools. Hand it a task and it searches, inspects code and follows dataflow with the same tools you use, over MCP or as an autonomous investigation.

  • Write sources and sinks in plain words, no query language needed
  • Generate an agent from a CVE write-up, an advisory, a PDF or a URL
  • Reuse one agent across many tasks
  • Works on local and hosted projects the same way
agent.py
import eptakode

api = eptakode.LocalAPI("./eptakode.toml")

agent = api.get_agent(
    name="sql-injection-hunter",
    description="Looks for unsanitized SQL built from request data.",
    sources=["a POST request field named 'username'"],
    sinks=["raw SQL execution via the query builder"],
    validators=["an allowlist check on the column name"],
    tools=["search", "inspect", "dataflow", "note", "hypothesis", "confirm"],
)

04 mcp · local

Plug eptakode into your own AI client

One command starts a local MCP server that exposes search, inspect, callsites, variable tracking and dataflow to Claude, your IDE or any MCP host. Run it against the platform, or fully offline on a codebase that never leaves your machine.

  • Works with Claude, IDE integrations and any MCP host
  • Offline mode: nothing touches the platform
  • Optional session logging adds notes, hypotheses and confirmations
  • stdio by default, or self-host over SSE / streamable HTTP
terminal
pip install eptakode

# fully offline, against a local project
eptakode mcp --local --project ./eptakode.toml

# or against the eptakode platform
export EPTAKODE_API_KEY="your-api-token"
eptakode mcp --project-id "..." --build-id "..."

# log every call as an investigation (adds note / hypothesis / confirm)
eptakode mcp --local --project ./eptakode.toml --use-session

05 functions

Functions

Code is organized around functions, along with their surrounding context: classes, namespaces and source files. Functions are the foundation of every analysis.

  • Count, list and search every function in a build
  • Stable ids that point straight back to the source file
functions.py
for fn in api.search_functions():
    print(f"name={fn.name}, filepath={fn.filepath}")

fn = api.get_function_by_id(fid="/example/src/07_array.cc:main#1")
print(f"fid={fn.fid}")

# output
# name=main, filepath=/example/src/07_array.cc
# name=addNumbers, filepath=/example/src/14_struct_arithmetic.cc
# fid=/example/src/07_array.cc:main#1

06 callsites

Callsites

Find where functions are called and inspect the variables passed as arguments. Search across the whole codebase or inside one function to understand usage and dependencies fast.

  • Search globally by callee name
  • Look at the arguments at every call
callsites.py
for fn, callsite in api.search_callsites(filter_by_name="malloc"):
    print(fn.fid, callsite.fn_name)

# output
# /example/src/03_scanf_to_malloc.cc:main#1 ['malloc']
# /example/src/13_struct_pointer_arithmetic.cc:main#1 ['malloc']

07 variables

Variables

Search and navigate variables, their types, definitions and uses inside a function. Variable analysis makes data relationships clear and tells overloaded signatures apart.

  • Arguments, locals and temporaries kept apart
  • Every definition and use, step by step
variables.py
fn = api.get_function_by_id(fid="/example/src/02_pointer_arithmetic.cc:main#1")

print(f"function_args = {fn.variable_manager.function_args}")
print(f"local_variables = {fn.variable_manager.local_variables}")
print(f"tmp_variables = {fn.variable_manager.tmp_variables}")

# output
# function_args = []
# local_variables = ['ptr', 'x', '68952807']
# tmp_variables = ['$T1', '$T2', '$T3', '$T4', '$T5', '$T17']

08 steps

Steps

Every function is a sequence of high-level operations. Reducing complex source and low-level instructions to a few operation types makes analysis faster and more intuitive.

  • One small set of operations across languages
  • Read any step back as decompiled code
steps.py
for step in fn.steps:
    print(step.op, step.decompile())

# output
# ASSIGN  sum = 0;
# CALL    printf  ( R"("Enter number of elements: ")" );
# CALL    *__isoc99_scanf  ( R"("%d")", &n );
# ASSIGN  $T1 = n;

09 control flow

Control flow graphs

Visualize execution paths, branches and loops inside a function. Control flow graphs help you understand program behavior and reason about complex logic.

  • Basic blocks, edges and exit nodes
  • Jump from a block to the steps inside it
cfg.py
fn = api.get_function_by_id(fid="/example/src/07_array.cc:main#1")
print(fn.cfg)

# output
# basicblock_exit_nodes=[4, 5]
# basicblock_steps={2: [0, 1, 2, 3], 3: [4, 5], 4: [6, 7], 5: [8, 9, 10]}
# basicblock_edges={2: [5, 3], 3: [4], 4: [], 5: []}

10 arrays

Arrays

Array operands keep their full context: indices, symbols and constants. Tracing array accesses and operand-level analysis gets much easier.

  • Base variable and index kept separate
  • Tokenized operands for precise matching
arrays.py
fn = api.get_function_by_id(fid="/example/src/07_array.cc:main#1")
step = fn.steps[0]

print(f"{step.op} {step.decompile()}")
print(step.dst.variable_name, step.dst.ssa_name)

# output
# ASSIGN  arr[0] = 10;
# arr arr_0

11 structs

Structs

Struct operands preserve field-level context, nested member access and related symbols, so you can inspect complex data structures and how they are used across the program.

  • Field-level context and nested members
  • Get the main variable without the noise
structs.py
fn = api.get_function_by_id(fid="/example/src/06_struct.cc:main#1")
step = fn.steps[3]

print(f"{step.op} {step.decompile()}")
print(step.src.lhs.variable_name)
print(step.variables_used_here)

# output
# ASSIGN  $T1 = &emp[i].Name;
# emp
# ['i', 'emp']